Elastic Stack Setup
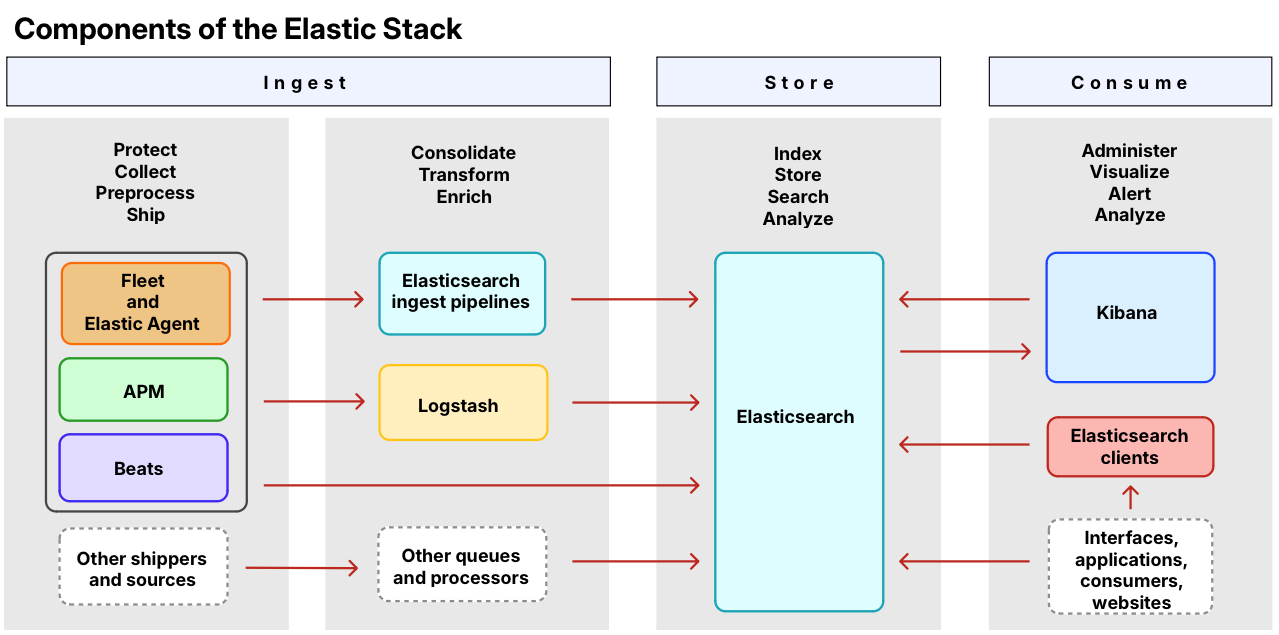
Overview
To get a feeling for how the user flow of an Analyst might look like, check out this Video: https://www.youtube.com/watch?v=C5bYHCjF4qI
Setting up the Basics
In this guide, based on the Elastic tutorials [2] [3], we'll set up the following:
Step 1: Set up the First Elasticsearch Node
- Create the following VM:
NAME: "Target-IT-Elasticsearch1" DISK: "500 GiB" CORES: "8 Threads" MEMORY: "32768 MiB" NETWORK: "TarIT" - Installing Elasticsearch from the APT repository
Note
Make sure you have the correct IP address for your server before installing Elasticsearch
[4]wget -qO - https://artifacts.elastic.co/GPG-KEY-elasticsearch | sudo gpg --dearmor -o /usr/share/keyrings/elasticsearch-keyring.gpg sudo apt-get install apt-transport-https echo "deb [signed-by=/usr/share/keyrings/elasticsearch-keyring.gpg] https://artifacts.elastic.co/packages/8.x/apt stable main" | sudo tee /etc/apt/sources.list.d/elastic-8.x.list sudo apt-get update && sudo apt-get install elasticsearch - Copy the terminal output from the installation command to a local file (you'll need that info later)
- Store the
elasticpassword in your shell:export ELASTIC_PASSWORD="your_password" - Enable Elasticsearch to run as a service:
sudo systemctl daemon-reload
sudo systemctl enable elasticsearch.service
Step 2: Configure the First Elasticsearch Node for Connectivity
- Copy the host's IP somewhere (using
ip a) - Uncomment and edit the following lines of the config:
sudo vim /etc/elasticsearch/elasticsearch.ymlcluster.name: elasticsearch-infosec network.host: 10.2.2.50 transport.host: 0.0.0.0
Step 3: Start Elasticsearch
Now, it's time to start the service and make sure it's running properly:
sudo systemctl start elasticsearch.service
sudo curl --cacert /etc/elasticsearch/certs/http_ca.crt -u elastic:$ELASTIC_PASSWORD https://localhost:9200
sudo systemctl status elasticsearch
Step 4: Set up Additional Elasticsearch Nodes
Elastic scales very well horizontally, but not very well vertically. So if you are experiencing performance issues, you need more nodes.[5]
To set up additional nodes, please have a look at steps 4 and 5 in the article this notes is based on:
Step 5: Install Kibana
- Create the following VM:
NAME: "Target-IT-Kibana1" DISK: "16 GiB" CORES: "1 Threads" MEMORY: "4096 MiB" NETWORK: "TarIT" - Installing Kibana from the APT repository
[6]wget -qO - https://artifacts.elastic.co/GPG-KEY-elasticsearch | sudo gpg --dearmor -o /usr/share/keyrings/elasticsearch-keyring.gpg sudo apt-get install apt-transport-https echo "deb [signed-by=/usr/share/keyrings/elasticsearch-keyring.gpg] https://artifacts.elastic.co/packages/8.x/apt stable main" | sudo tee /etc/apt/sources.list.d/elastic-8.x.list sudo apt-get update && sudo apt-get install kibana - Back on the Kibana host, enable Kibana:
sudo systemctl daemon-reload sudo systemctl enable kibana.service - Copy the host's IP somewhere (using
ip a) - Generate a new encryption keys:
sudo /usr/share/kibana/bin/kibana-encryption-keys generate - Uncomment and edit the following lines of the config:
sudo vim /etc/kibana/kibana.yml
[7]server.host: 10.2.2.51 xpack.encryptedSavedObjects.encryptionKey: "min-32-byte-long-strong-encryption-key" xpack.reporting.encryptionKey: "min-32-byte-long-strong-encryption-key" xpack.security.encryptionKey: "min-32-byte-long-strong-encryption-key" - Start the service and make sure it's running properly:
sudo systemctl start kibana.service sudo systemctl status kibana - In the status, copy out the URL with a 6 digit verification code to get started. It should look something like this:
Go to http://10.2.2.51:5601/?code=000000 to get started. - Generate a Kibana enrollment token on the first Elasticsearch Node:
sudo /usr/share/elasticsearch/bin/elasticsearch-create-enrollment-token -s kibana - Open the website and paste the enrolment token we generated previously on the Elasticsearch Node
- When you see the Welcome to Elastic page, provide the username
elasticthe password that you copied when we installed the first Elasticsearch Node (theELASTIC_PASSWORDone)
Step 6: Securing the Elastic Stack
Beginning with Elastic 8.0, security is enabled in the Elastic Stack by default, meaning that traffic between Elasticsearch nodes and between Kibana and Elasticsearch is SSL-encrypted. While this is suitable for testing non-production viability of the Elastic platform, most production networks have requirements for the use of trusted CA-signed certificates. These steps demonstrate how to update the out-of-the-box self-signed certificates with your own trusted CA-signed certificates.
=> https://www.elastic.co/guide/en/elastic-stack/current/install-stack-demo-secure.html
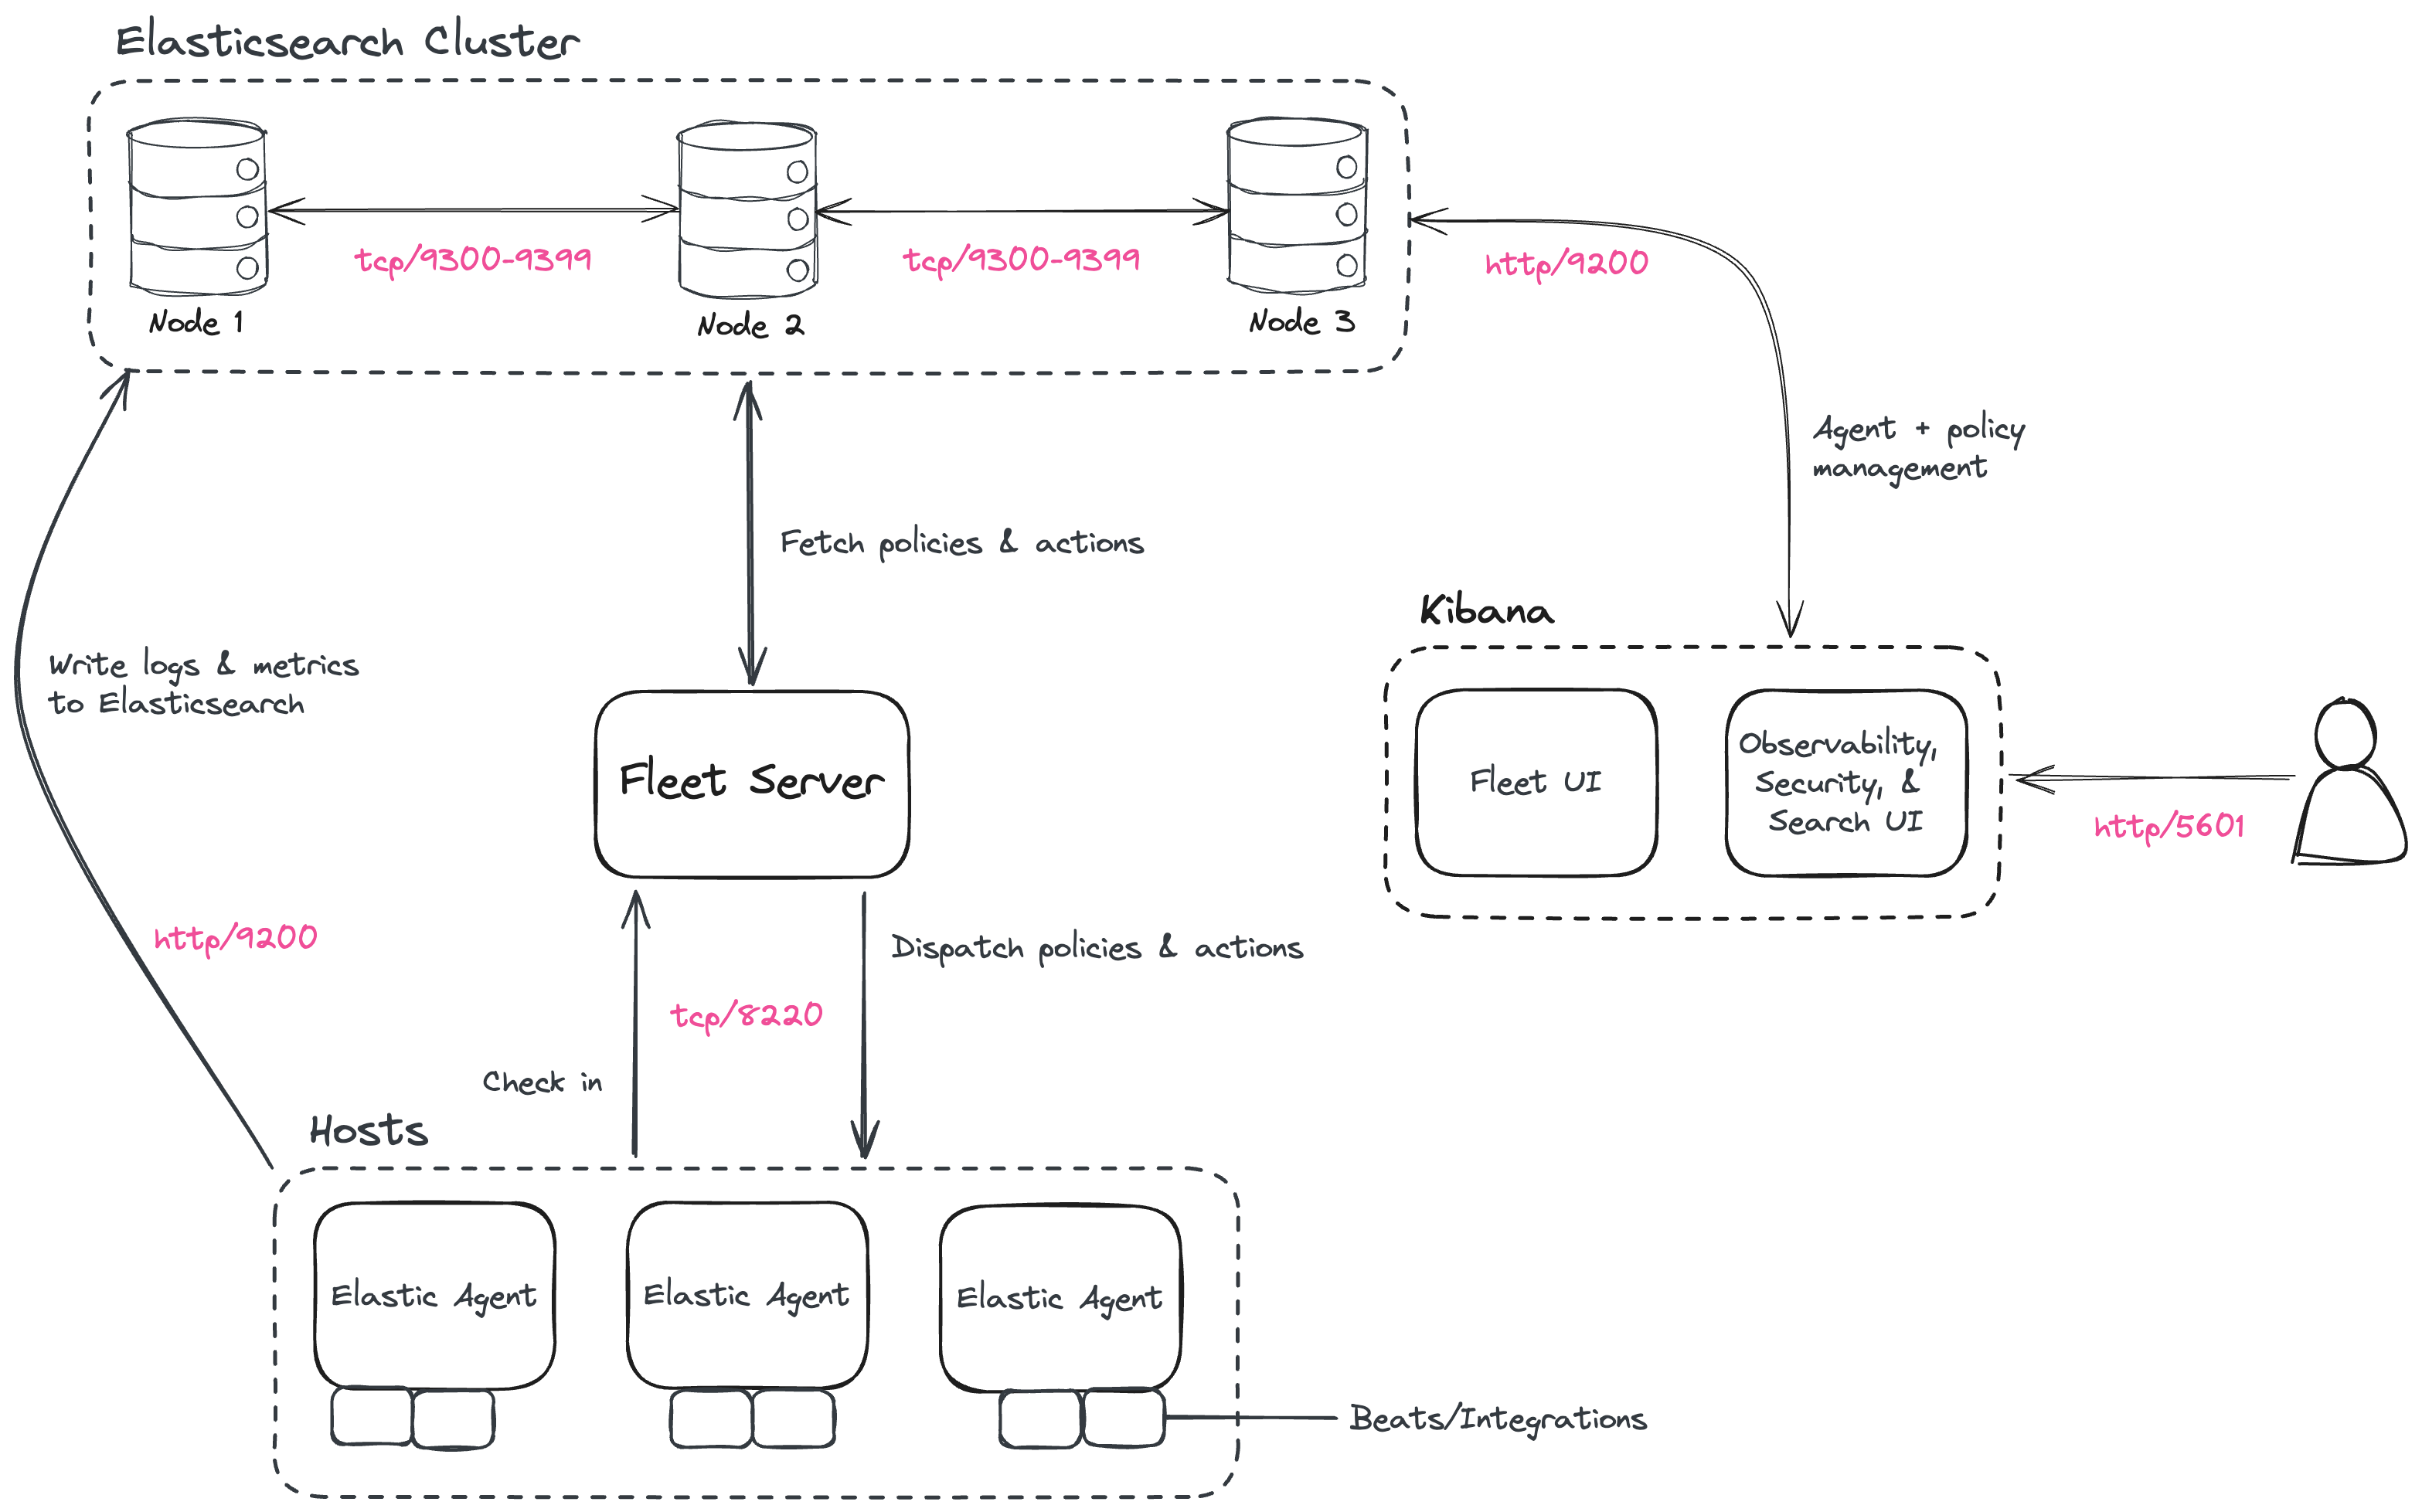
Step 7: Install Fleet Server
- Create the following VM:
NAME: "Target-IT-FleetServer1" DISK: "16 GiB" CORES: "1 Threads" MEMORY: "4096 MiB" NETWORK: "TarIT" - Create a working directory:
mkdir fleet-install-files cd fleet-install-files - Copy the host's IP somewhere (using
ip a) - Back to your web browser, open the Kibana menu and go to
Management -> Fleet - Click
Add Fleet Server - Specify a name for your Fleet Server host, for example
FleetServer1. - Specify the host URL where Elastic Agents will reach Fleet Server, for example:
https://10.2.2.52:8220(use the IP from the host we just set up) - Click
Generate Fleet Server policy - On the
Install Fleet Server to a centralized hoststep, select theLinux Tartab - Copy and paste the generated commands in the terminal on your Fleet Server host
- At the prompt, enter
Yto install Elastic Agent and run it as a service. Wait for the installation to complete - In the Kibana Add a Fleet Server flyout, wait for confirmation that Fleet Server has connected
- For now, ignore the Continue enrolling Elastic Agent option and close the flyout
Step 8: Install Elastic Agent
- Log in to the host where you'd like to set up Elastic Agent
- Create a working directory for the installation package:
mkdir agent-install-files cd agent-install-files - Open Kibana and go to
Management -> Fleet - Open the
Settingstab - Reopen the
Agentstab and selectAdd agent - In the flyout, choose a policy name, for example
Demo Agent Policy. - Leave Collect system logs and metrics enabled.
- Click
Create policy. - For the "Enroll in Fleet?" step, leave
Enroll in Fleetselected - On the Install Elastic Agent on your host step, for this example we select the
Linux Tartab - Copy and paste the generated commands in the terminal on your Fleet Server host
- Append an
--insecureflag at the end.NoteIf you want to set up secure communications using SSL certificates, refer to Tutorial 2: Securing a self-managed Elastic Stack.
- At the prompt, enter
Yto install Elastic Agent and run it as a service. Wait for the installation to complete - In the Kibana Add a Fleet Server flyout, wait for confirmation that Elastic Agent has connected
Setting up the Security
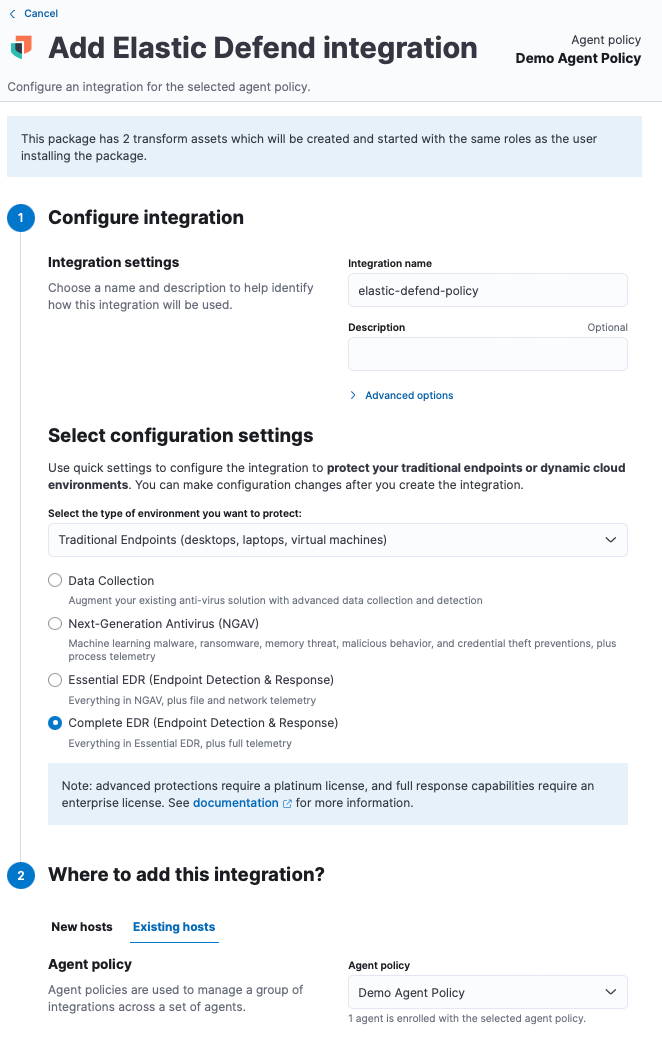
Step 1: Add Elastic Defend Integration
- Go to the Integrations page, by going to Kibana:
Management -> Integrations - Search for and select
Elastic Defend, then select Add Elastic Defend - Configure the Elastic Defend integration with an Integration name, for example:
elastic-defend-policy - Select
Traditional Endpointsas the type of environment you want to protect - Select
Complete EDRas the configuration preset - Click the
Existing hoststab and select the Demo one we just created. - Save and continue
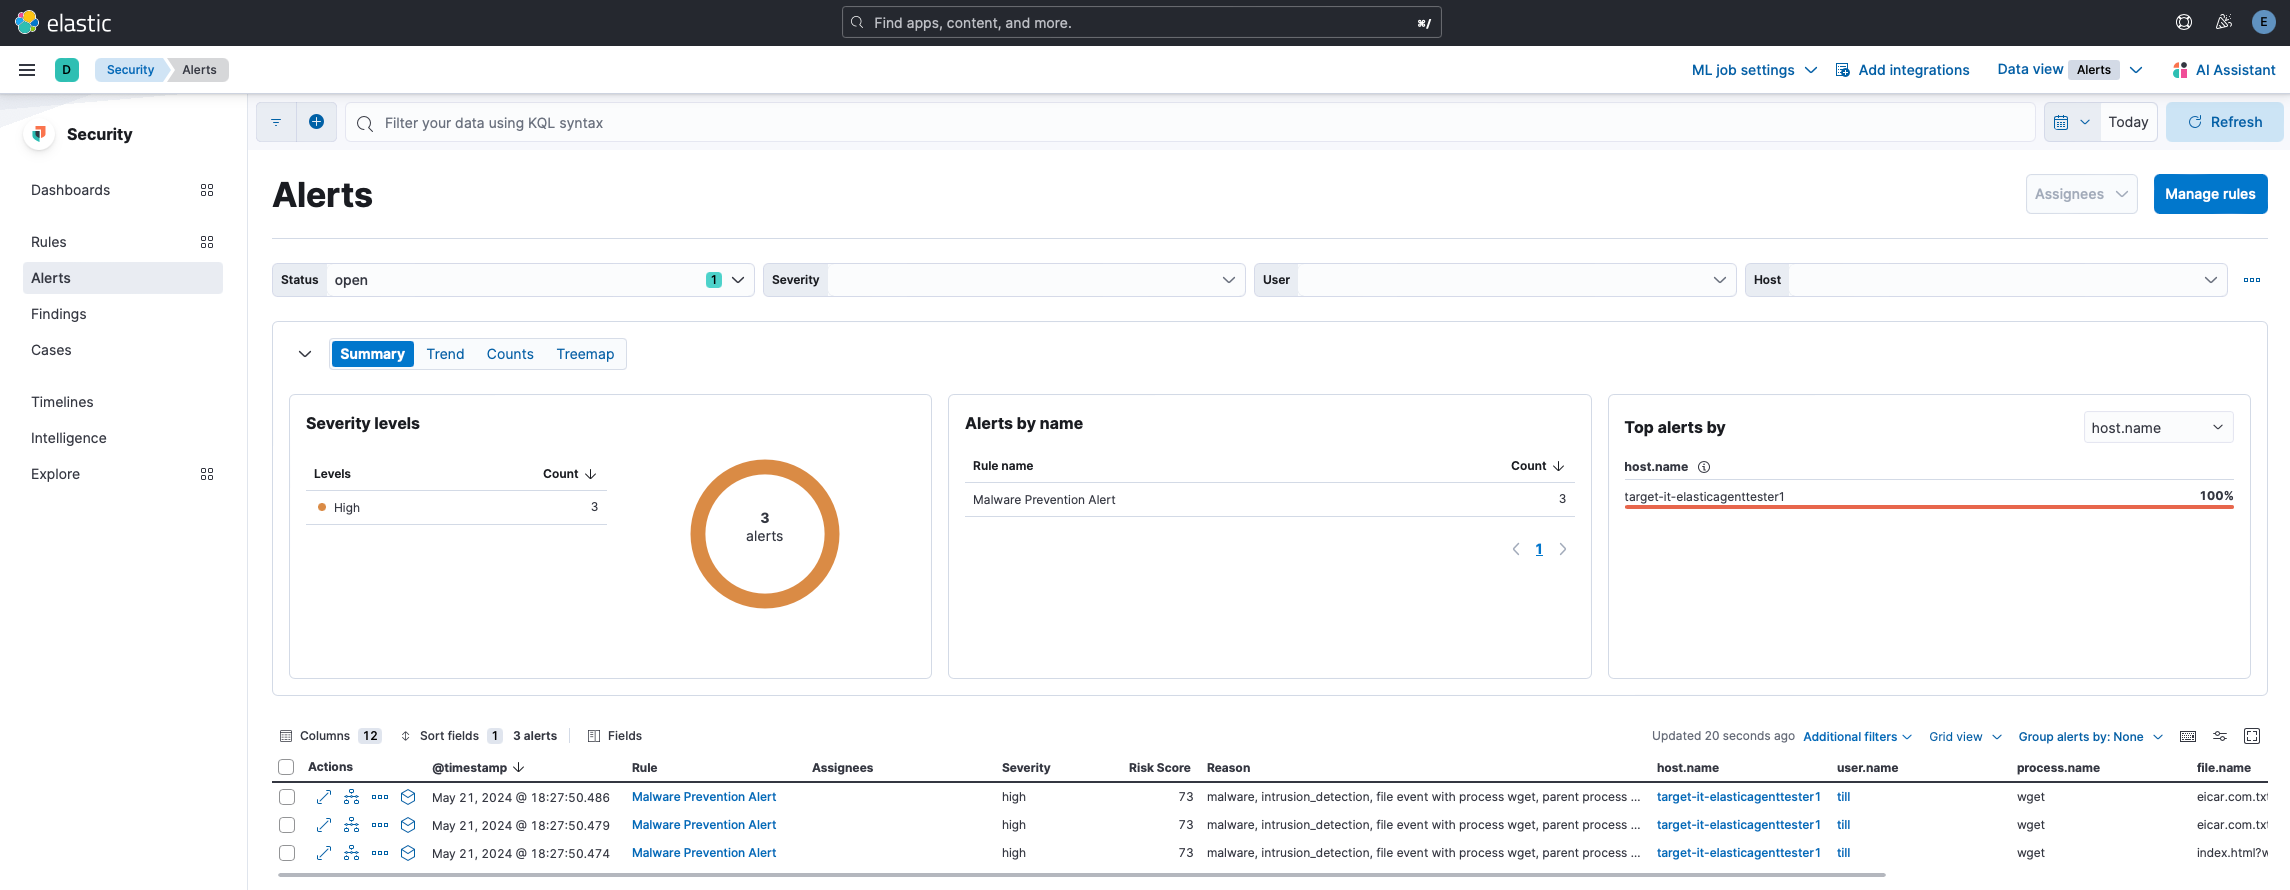
Step 2: Test if the Integration is Working
- Log into an Endpoint where the Elastic Agent has been deployed
- Download a EICAR file:
wget https://secure.eicar.org/eicar.com.txt - Under
Security -> Alertsyou should now see some alerts:
Step 3: Enable Detection Rules
- Go to the Rules page, by going to Kibana:
Security -> Rules -> Detection rules - Click on
Add Elastic rules - Click on
Install all - Now go back and click on
Select all 1171 rules - Under
Bulk actions, selectEnable
Step 4: Configure Auditd & Windows Integrations
Auditd Manager
Install Auditd on Your Clients
sudo apt update
sudo apt install auditd
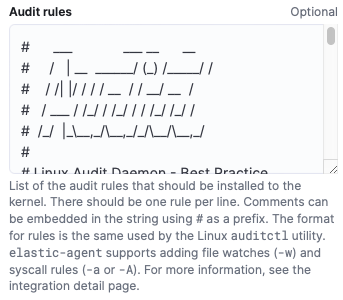
Setup the Auditd Manager Integration
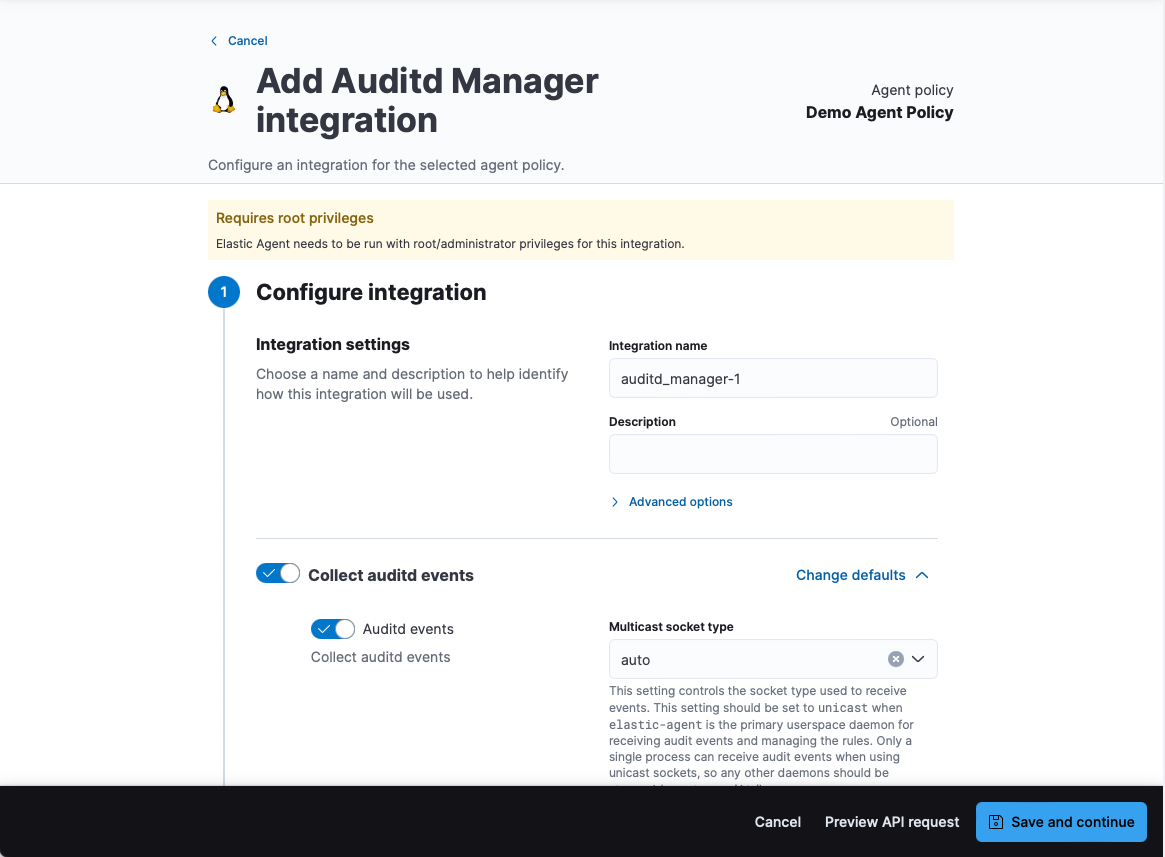
In this lab I'm going to use Audit Deamon Rules, so we're going to copy and paste those rule into the Audit rules field:
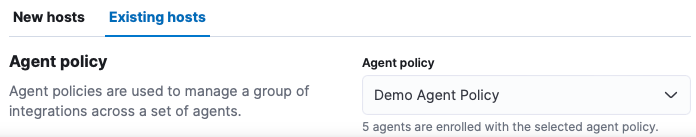
Make sure to use the existing Demo Agent Policy:
Make Sure Your Agents Are Still Healthy
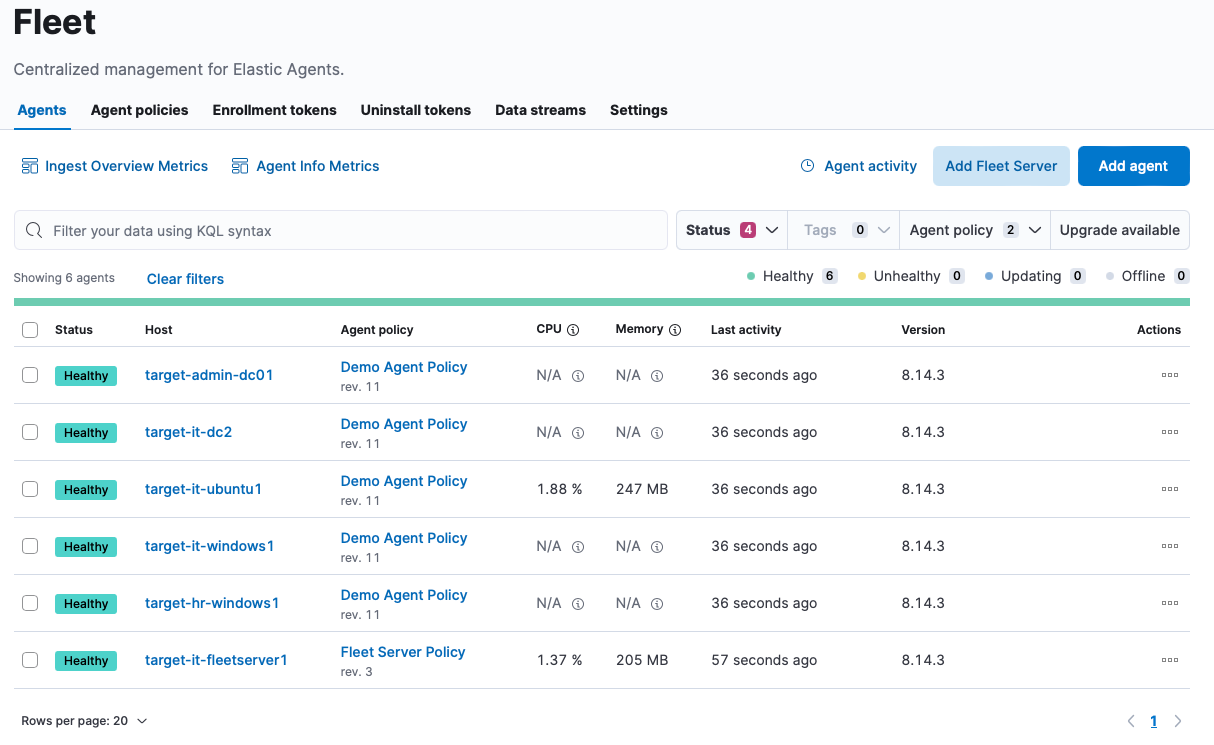
If not you might need to change the Auditd rules.
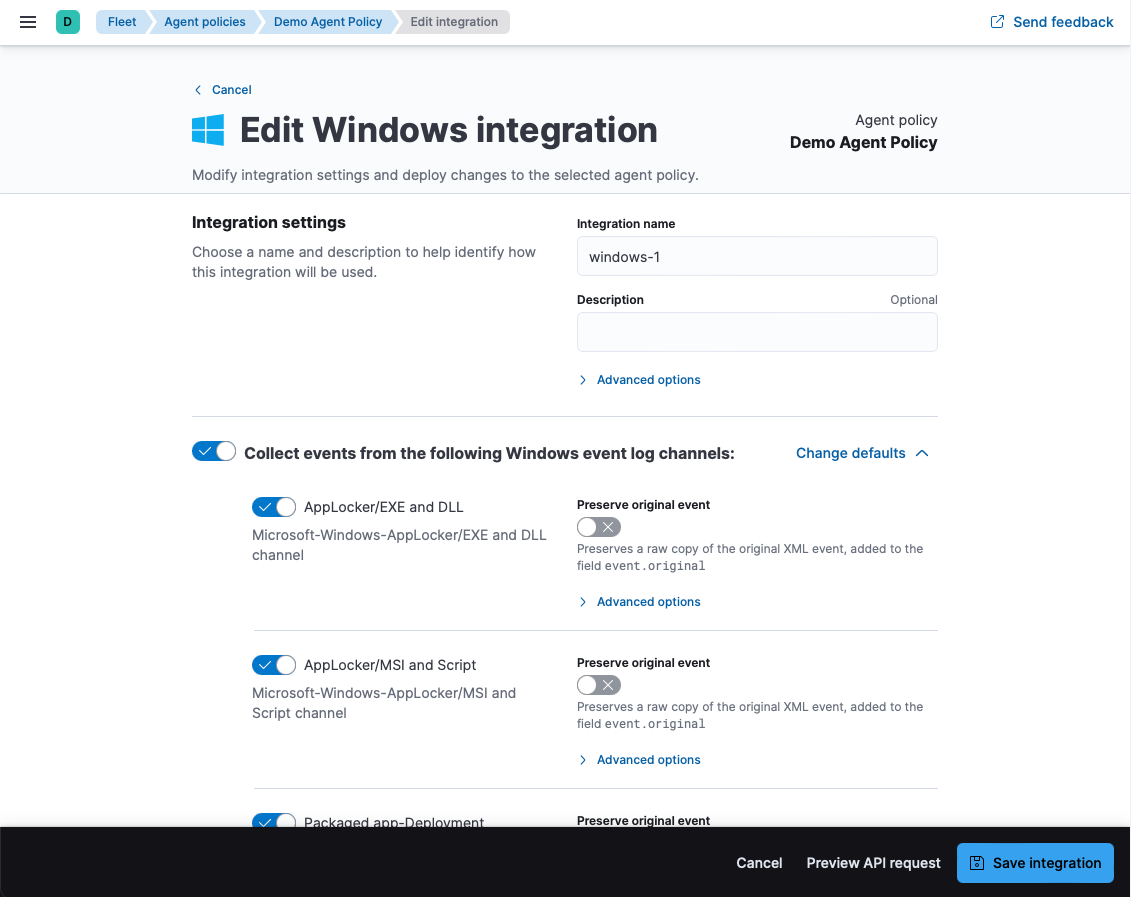
Windows
- Head to
Managment -> Integrationsand search for an Integration called Windows:
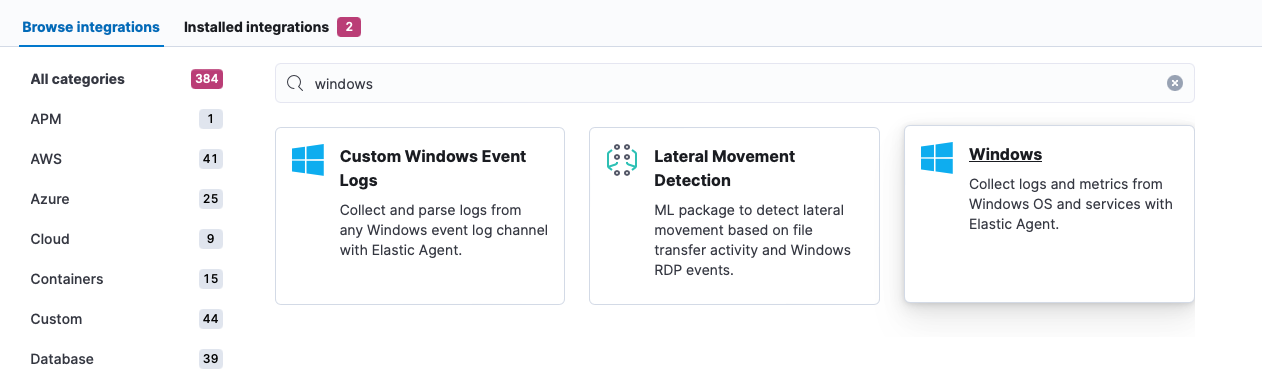
- Set the toggles you want and install it to the Demo Agent Policy we've already created:
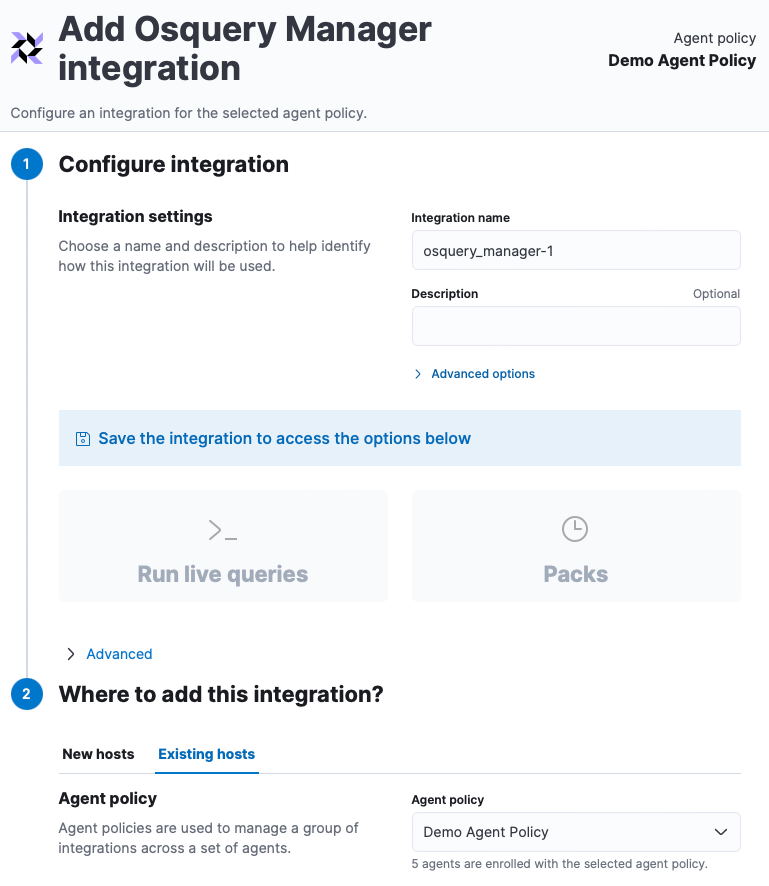
Step 5: Configure Osquery Manager Integration
Make sure to use the existing Demo Agent Policy:
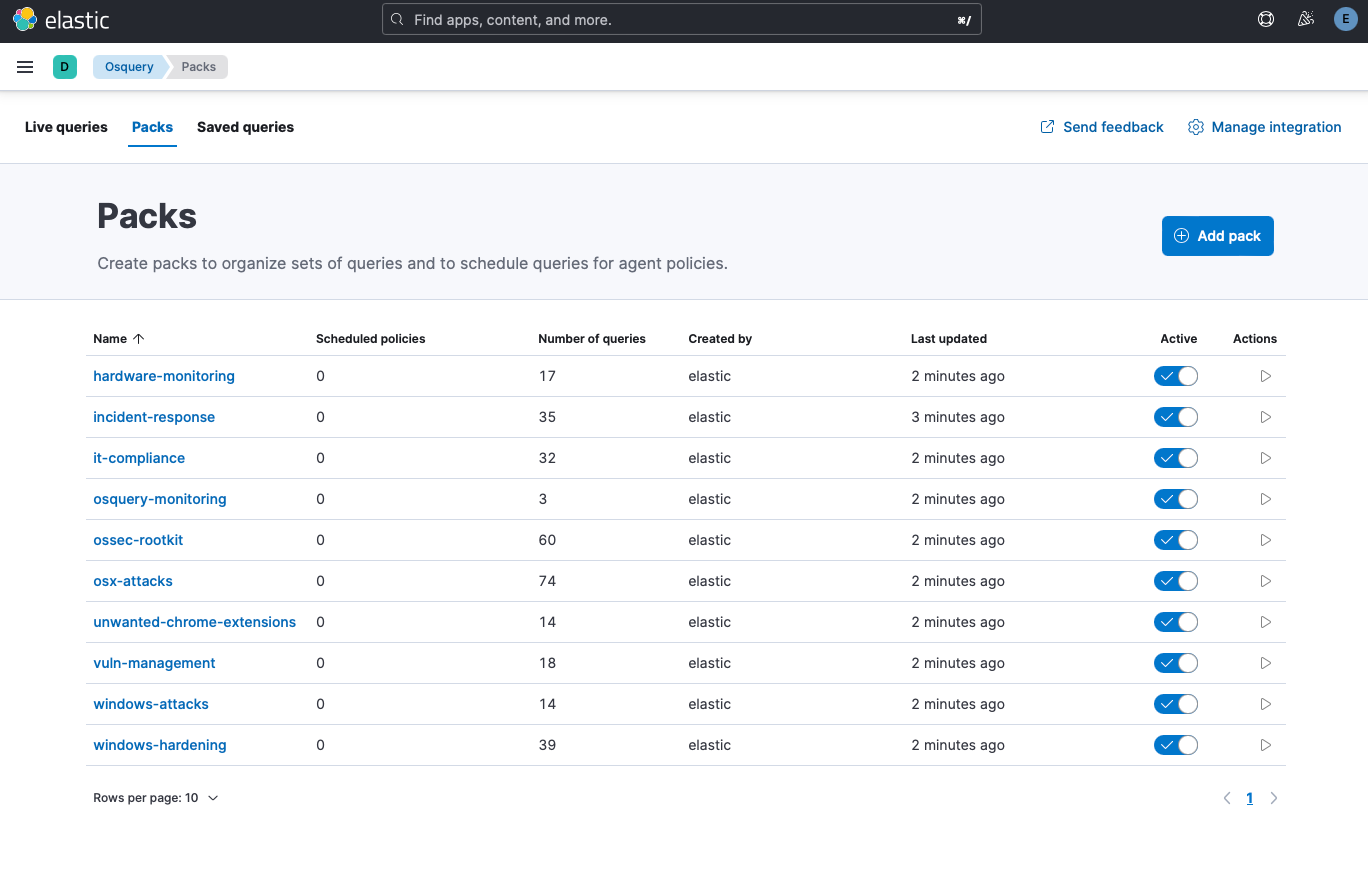
Once installed, enable all existing packs under Managment -> Osquery:
(Optional) Step 6: Enable pfSense/OPNsense Integration
Install the Integration on Kibana
- Go to the Integrations page, by going to Kibana:
Management -> Integrations - Search for and select
pfSense. - Give the Integration a name, for example:
opnsense-1 - Set the Syslog Host to
0.0.0.0 - Set the Syslog Port to
9001 - Click the
Existing hoststab and selectFleet Server Policy
Configure Remote Logging on OPNsense
- Navigate to
System -> Settings -> Logging - Click on the
Remotetab - Add a new Logging/Target (Click the plus icon)
- Transport = UDP
- Applications = Nothing Selected (this will forwar all logs)
- Levels = Nothing Selected
- Facilities = Nothing Selected
- Hostname = IP of Fleet Server
10.2.2.52 - Port =
9001 - Description =
Syslog to Elasticsearch
- Click Save
- And don't forget to hit
Apply
(Optional) Step 7: Enable Additional Integrations
AbuseCHNetwork Packet CaptureDefend for ContainersLateral Movement DetectionData Exfiltration DetectionLiving off the Land Attack DetectionDomain Generation Algorithm Detection
Relevant Note(s):
https://www.elastic.co/guide/en/starting-with-the-elasticsearch-platform-and-its-solutions/current/stack-components.html ↩︎
https://www.elastic.co/guide/en/elastic-stack/current/installing-stack-demo-self.html ↩︎
https://www.elastic.co/guide/en/elastic-stack/current/install-stack-demo-secure.html ↩︎
https://www.elastic.co/guide/en/elasticsearch/reference/current/deb.html ↩︎
https://blog.octoperf.com/elasticsearch-optimization-guide/ ↩︎
https://www.elastic.co/guide/en/kibana/current/xpack-security-secure-saved-objects.html ↩︎
https://www.elastic.co/guide/en/security/current/install-endpoint.html#add-security-integration ↩︎
https://www.elastic.co/security-labs/linux-detection-engineering-with-auditd ↩︎
https://www.elastic.co/guide/en/kibana/current/manage-osquery-integration.html ↩︎
https://www.elastic.co/guide/en/kibana/current/osquery.html ↩︎